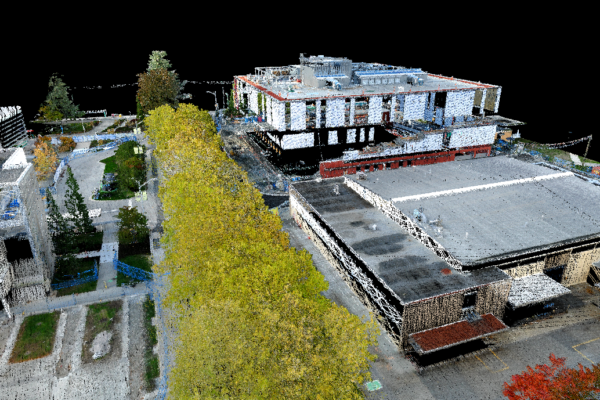
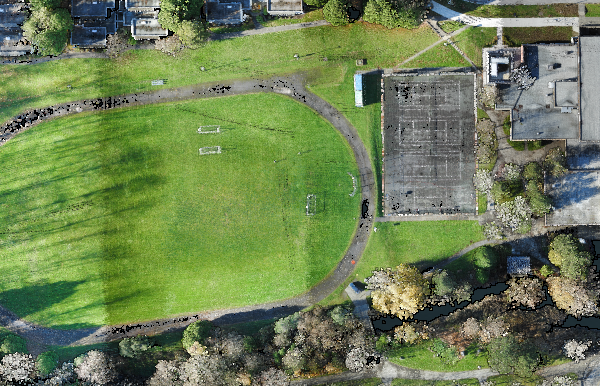
To get a better understanding of how RPAS are used in aerial topographic mapping, explore these campus models created by Sean Galway of BCIT’s Geomatics Engineering program.
Sean mapped the entire Burnaby campus using a LiDAR system mounted on a drone. LiDAR (light detection and ranging) uses reflected light pulses to measure distances between a scanner and nearby surfaces, collecting a “cloud” of points that can be processed into 3D images. Using a three-component system consisting of a scanner, GPS, and inertial measurement unit, LiDAR can accurately map the spatial relationships of both natural and man-made structures on the earth’s surface.
Mission Date: Fall 2021
System: DJI- M600/Geocue TV410-3DIS
PIC: Sean Galway (TC-AdvOps)
To explore the models:
- Open the links with a Chrome or Firefox browser.
- Right-click to move the image, left-click to rotate, and use the scroll button to increase and decrease the image.
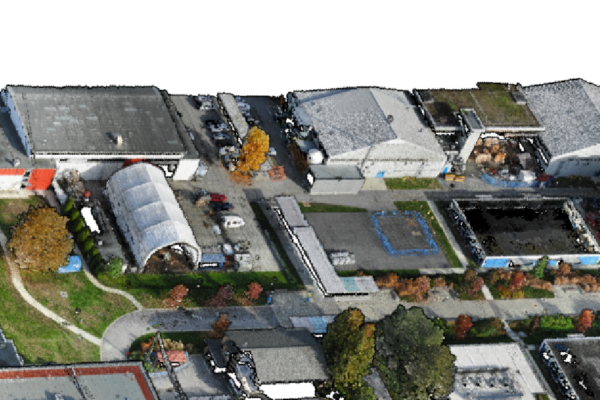


Point clouds
A point cloud is a mass of “point” measurements collected by a laser scanner or digital camera. Each point consists of latitude, longitude, and elevation, and may contain colour or part of an image.
Point clouds can be processed into many different models, such as digital elevation models or digital surface models.
Potree
Potree is a web viewer that hosts large point clouds. Users can view 3D models of the cloud without downloading the data set.
From helicopters to drones
For those of us just playing around with these campus models, they may seem ordinary in this day of advanced technology. But for Sean Galway, who has worked in the LiDAR sector for years, they represent the momentous change that drones have brought to the field in less than a decade.
Ten year ago, when Sean worked as a LiDAR specialist and logistics planner surveying powerlines, the job required a helicopter and took seven or eight people the entire day to map an area the size that Sean can now map with a drone in half a day!
Back then, an aerial mapping operation required a mechanic to install the sensor payload on the helicopter, a pilot and equipment operator to fly the mission and capture data, a ground crew of two or three surveyors in pick-up trucks to set equipment along the powerlines, and someone in the production shop to process the data overnight.
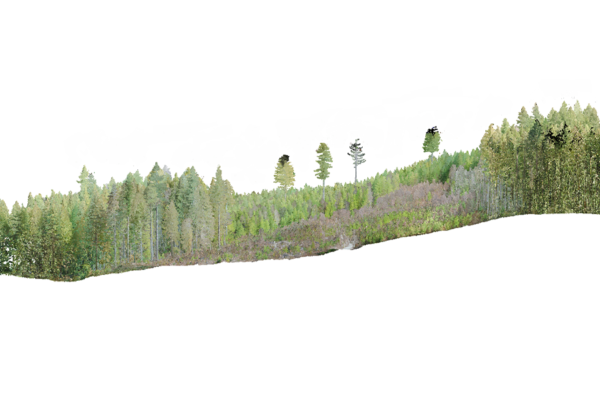
Around 2015, drones emerged as a more economical and accessible alternative to helicopters. The catch was that RPAS pilots generally used photogrammetry technology since it required just one sensor—the camera—and did not require GPS. LiDAR is more complex, requiring GPS positioning, highly accurate inertial measurement units, and multiple sensors that need to be linked together through software. However, LiDAR has greater applicability because the sensors can penetrate the tree canopy and create a variety of models for use in fields such as forestry and surveying.
In 2021, now working as a LiDAR specialist and instructor in the BCIT Geomatics department, Sean decided he wanted to run a start-to-finish mission that brought all his former skills into the drone playing field. This meant getting his pilot’s licence and looking after site survey control, logistics, flight data capture, and data-processing and, finally, delivering a dataset that could be used by the BCIT community at large.
With an RPAS from the Learning and Teaching Centre and help from the LTC’s Chris Cambon, Sean started his first flight over campus. As he started to fly, he had to stop for a moment to take it in. “So my last time flying a LiDAR sensor was on a helicopter in 2012 and now less than 10 years later, here we are with a LiDAR payload on a drone, and not only did we receive it that morning, cradle it, mount it, and fly it that afternoon, but by the end of the day, within an hour, I had already spun out and created some point cloud output!” By mid-morning the next day, Sean had mapped the entire Burnaby campus.
The final step for Sean was finding a way to showcase the data in a way people could relate to. This was solved by the BCIT Sitecentre, who have hosted the data using a data visualization architecture called Potree (see sidebar).