
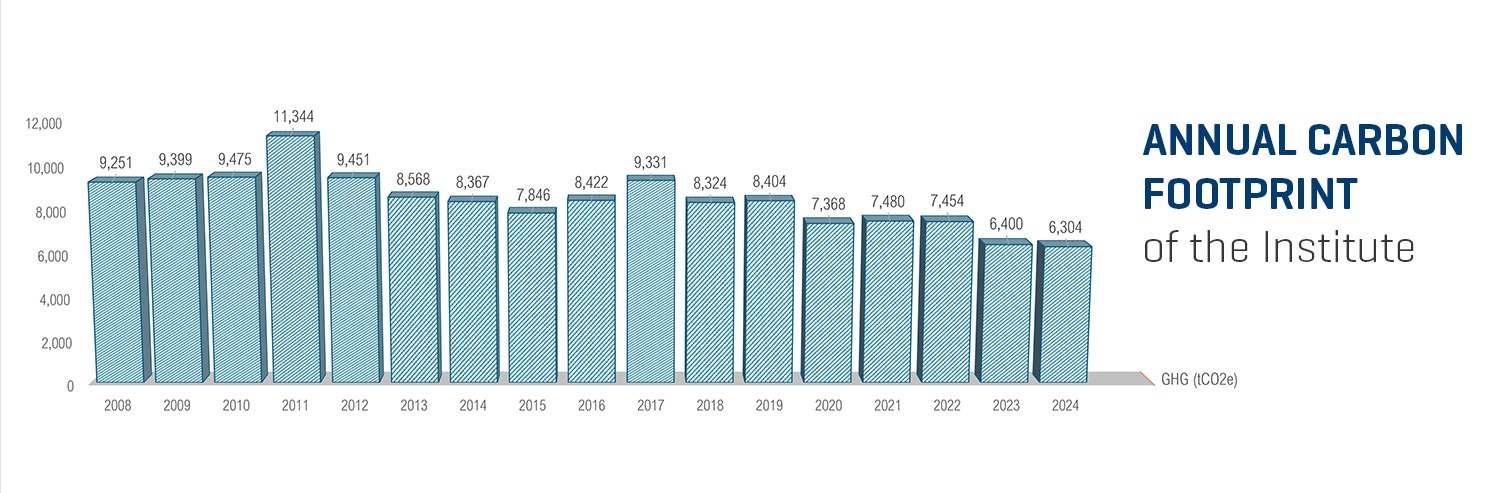
Institutional Carbon Emissions
BCIT sets ambitious targets for it’s carbon emission reduction, with the intention of delivering a 50% reduction in emissions from baseline levels by 2030.
Building Level Data
Monitoring the energy usage at the level of individual buildings allows for more targeted energy efficiency initiatives.
This graph show the Energy Usage Intensity of some our buildings. It’s calculated by dividing the total energy consumed by the building in one year by the building’s floor area. It’s a good way to understand which buildings are energy efficient. At BCIT a building like NE8, has a much higher EUI than NW4, although it uses less total energy.
We can use this data to target improvements in specific buildings to make them more efficient.

Building Data
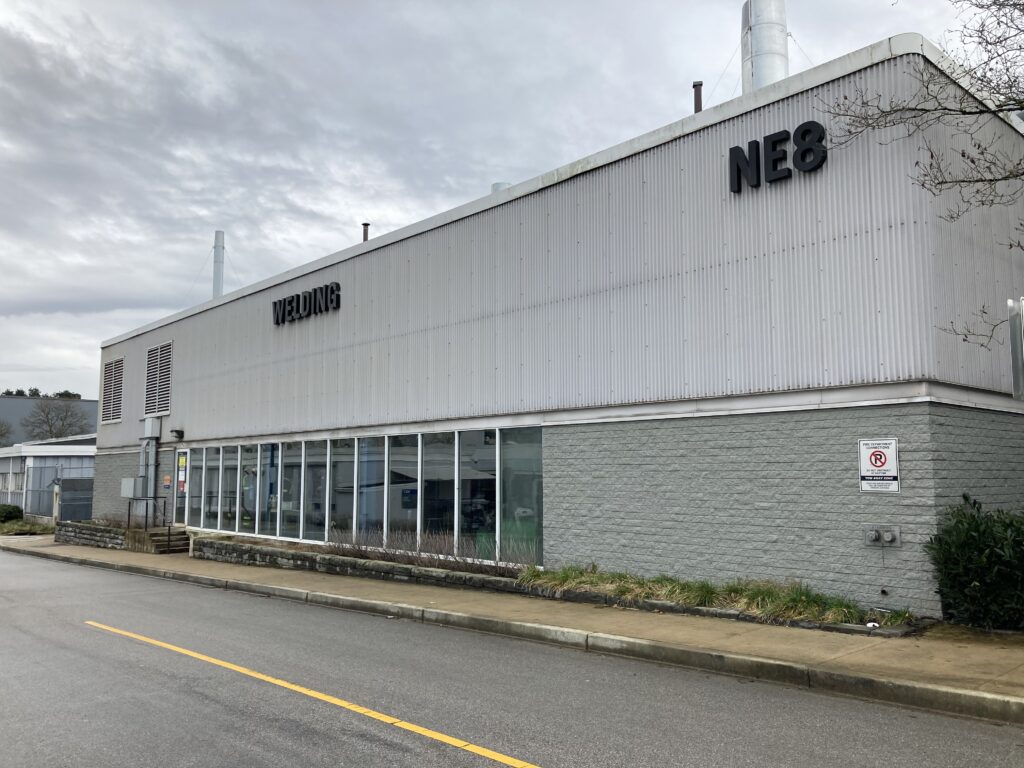
NE8:
Built 1981
Total Floor Area: 2,395 (Sq m)
Existing EUI (ekWh/m2): 825
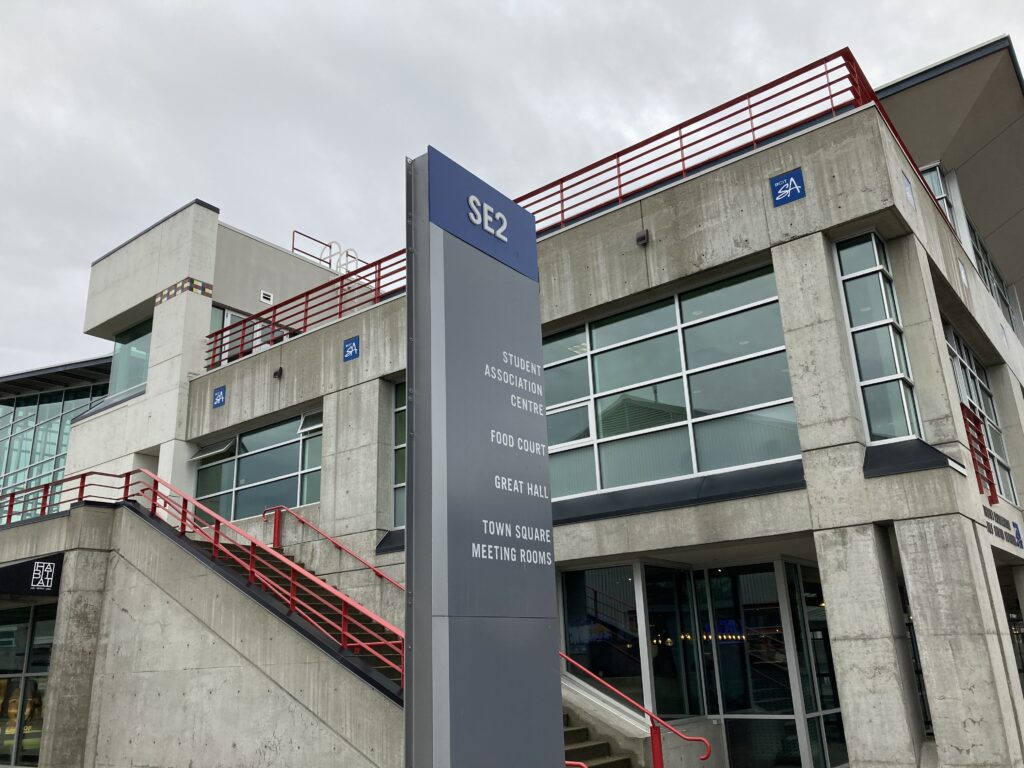
SE02
Built: 1994
Total Floor Area: 8,857 (Sq m)
Existing EUI, 463

CARI
Built: 1990
Total Floor Area: 10,884 (Sq m)
Existing EUI: 339
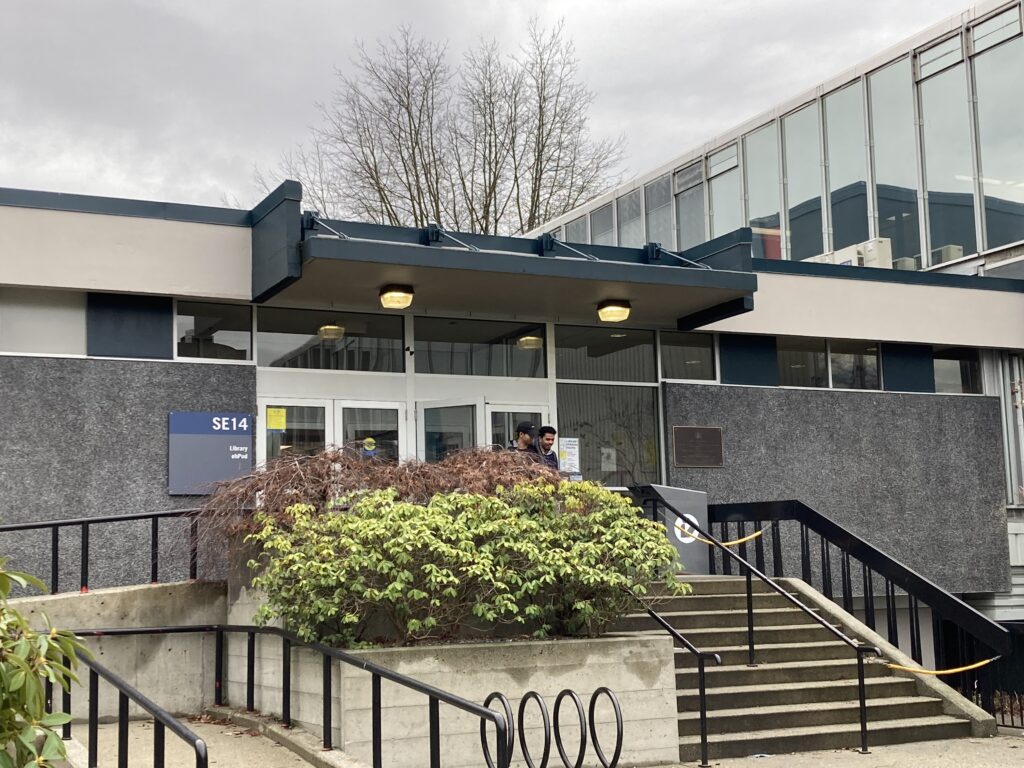
SE14
Built: 1972
Total Floor Area: 6,919 (Sq m)
Existing EUI: 237
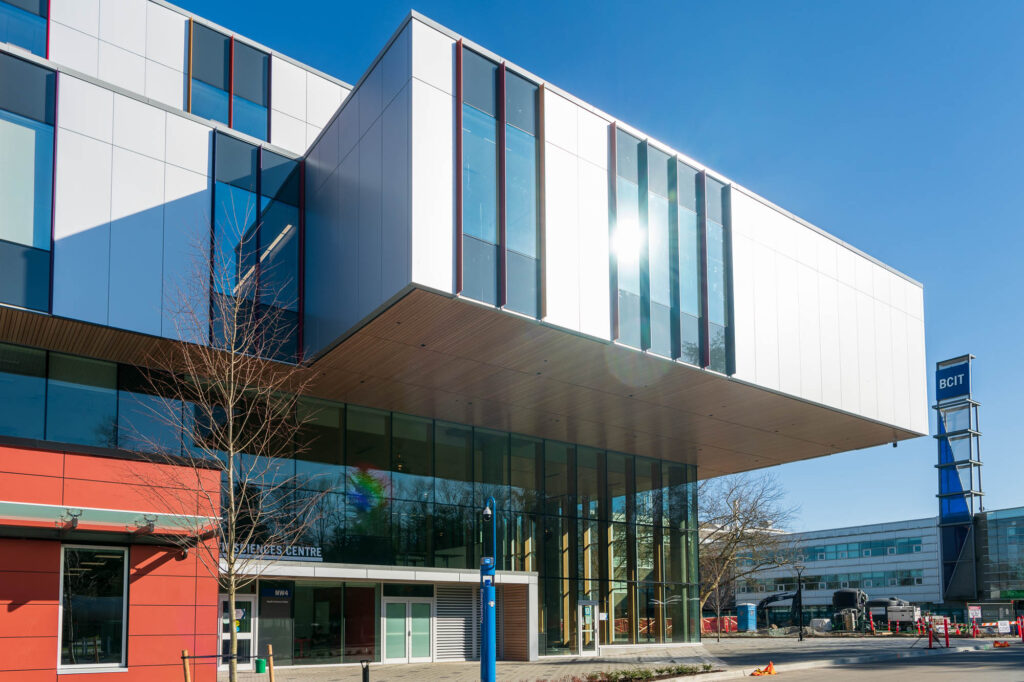
NW4
Built: 2022
Total Floor Area: 10,354 (Sq m)
Existing EUI: 170

Aerospace Technology Campus
Built: 2007
Total Floor Area: 30,006 (Sq m)
Existing EUI: 116
Downtown Campus
Built: 1996
Total Floor Space: 26,420 (Sq m)
Existing EUI: 111
Energy Projects
Find out more about the wide range of energy efficiency projects that the team are currently involved in.