BCIT Campus Planning and Facilities worked with Watt Consultancy Group and the campus community, on developing a comprehensive Transportation Demand Management (TDM) Strategy, completed in 2023. This Strategy provides a roadmap for how the BCIT Burnaby campus will advance sustainable transportation.
Purpose of the Study
- Estimate existing transportation demand at the Burnaby campus, including the number of trips by travel mode and the number of vehicles that park on campus.
- Forecast future transportation demand at the Burnaby campus with consideration of campus growth and regional transportation trends.
- Review of best practices from other post-secondary institutions in BC, Canada, and the United States.
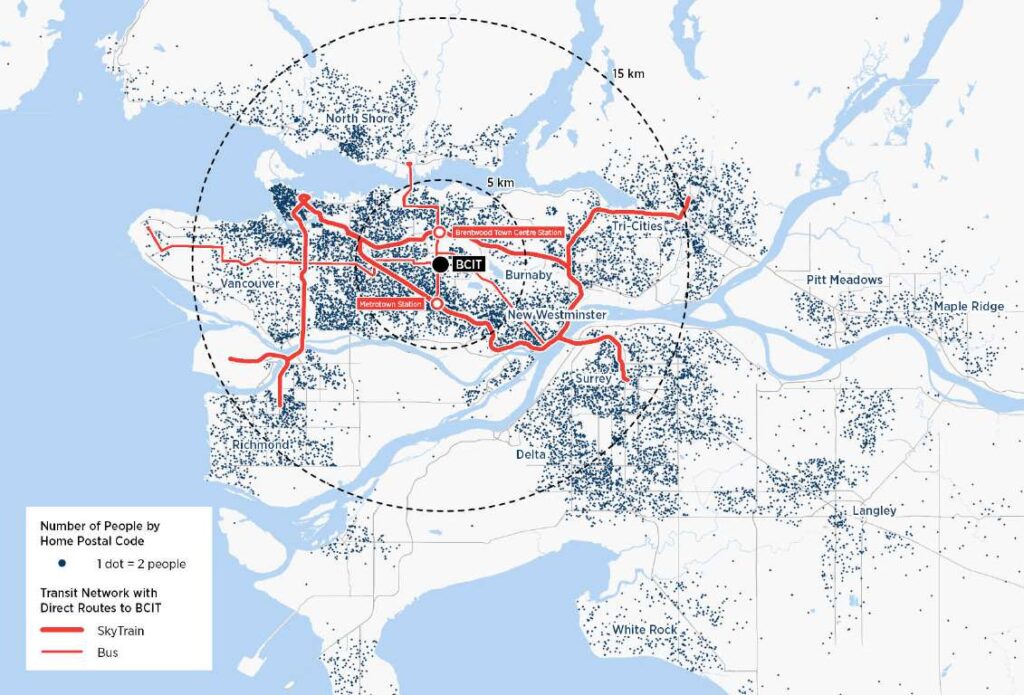
Modes of Travel to Campus
- The BCIT Burnaby campus sees approximately 19,000 person trips per day.
- Research for study found an on an average of 18,978 on a fall weekday in 2021.
- This includes 13,093 inbound trips and 5,885 outbound trips from 6:30a.m. in the morning to 7:30 p.m. in the evening.
- 274 of the 18,978 trips (162 inbound; 112 outbound) were associated with truck traffic.
- This results in a trip generation rate of 1.419 person trips per student FTE and 0.718 Single Occupancy Vehicle trips per student FTE
Breakdown of Journeys to Campus by Travel Mode
| Travel Mode Group | Travel Mode | Percent | |
| Students | Employees | ||
| Non- Sustainable | Drive Alone | 44% | 67% |
| Sub-Total | 44% | 67% | |
| Sustainable | Transit | 46% | 16% |
| Carpooling | 6% | 5% | |
| Walk | 4% | 4% | |
| Cycle & Roll | 8% | ||
| Sub-Total | 56% | 33% | |
| Total | 100% | 100% | |