Co-op student analytics project
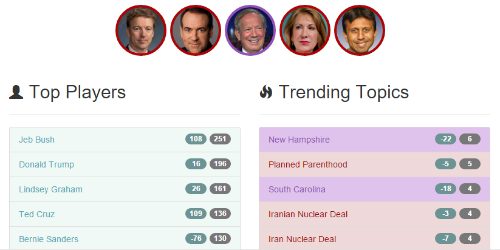
BCIT co-op students Trevor Broderick and Tom Tang worked under the direction of Dr. William Spat of IOTO International Inc., to help develop Goverlytics, a solution which applies cognitive computing to political information to help improve analytical objectivity. Initial projects include the 2015 federal election in Canada, and the 2016 US Presidential election. Goverlytics incorporates IBM Watson technologies for real-time analysis of speeches, blogs, websites, and online political posts, in the hopes of removing natural human biases from political reporting.
Financial sector analytics
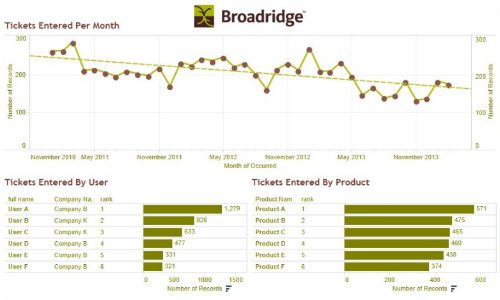 “COMP 2256 was an enjoyable, interesting, and practical class. The instructor, Donabel Santos, is very knowledgeable and the course is well structured. This is our Dashboard we created for the final class project. We created it using sample ticketing data from our project sponsors and employer, Broadridge Financial Solutions. We have since modified it to use real data and in turn, have been able to discover valuable insights into how clients use Broadridge products. This has been presented to the clients, so they are better aware of the tickets they enter. We highly recommend the class and Tableau to anyone that wants to visualize big data.”
~ Michael Marland & Kevin Chang, Broadridge Financial Solutions
Game design analytics
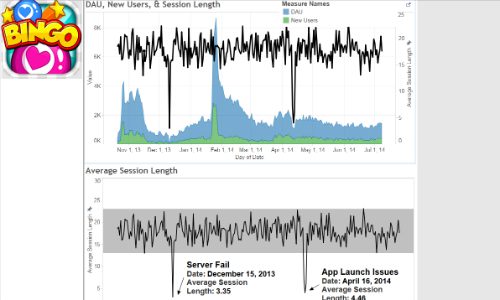 “I created a dashboard with an overview of one of our games, with a time series motion graph of our main KPIs, as well as charts which showed a more in-depth view of our high value players. COMP 2256 covered the basics of data visualization and then continued on to the more advanced features of Tableau. I use Tableau at work regularly and I’m able to quickly and easily create powerful dashboards and data visualizations thanks to this class.”
~ David Balcom, Data Analyst at a Game Design Studio
Social services analytics
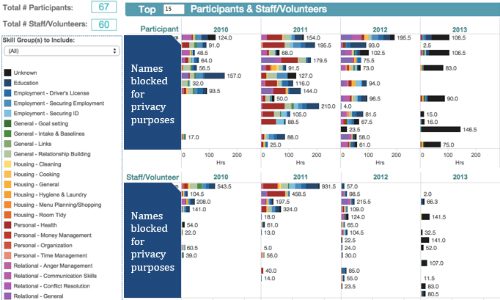 “For my project, I partnered with a non-profit called Inner Hope, an organization dedicated to serve at-risk youth in Vancouver. While they collected a lot of data, much of it was in formats not readily available for analyzing. I helped them convert their historical data into tabular formats suitable for analysis, and created various Tableau dashboards for them to dice and slice the data and visualize the work they have done. The most impactful work is probably the fact that they have changed their data collection process as a result and from now on can collect good data that is readily available for reporting and analysis.”
~ Chi Kin Ho, Student
E-Procurement & data warehousing
Health Shared Services BC (HSSBC) hosted BCIT Business Information Technology Management (BITMAN) students Anthony Wong, Ramin Nikzat and Joaquin Paniagua for a data analytics project. They provided integration and SQL database expertise (data mining and normalization) for their e-procurement system implementation. They performed analysis, audits, research, data comparison, and developed database configurations.
Students conduct analytics workshops in Austria
Students in the Business Information Technology Management (BITMAN) program developed a project consisted of six phases involving exploratory research with industry, several levels of business case development and usability testing, and culminating in analytics workshops delivered at an international conference in Austria. Results of this research project served to show the effectiveness of using the SAP Business ByDesign cloud computing system to enable students and industry to gain valuable business analytics knowledge which will help them make data-driven strategic decisions and remain competitive in a global market.
BCIT smart microgrid project

Analytics helps BCIT’s Smart Microgrid shape the future of energy using predictive forecasting models. Electric power utilities around the world are facing a serious crisis: aging infrastructure, rising demand for electricity, and environmental concerns have made it crucially important to improve the efficiency of distribution and intake of electricity to their power grid; we have to do more with less electricity.
Analytics plays a huge part in the analysis of data generated by the smart microgrid. Of particular importance is the forecasting information analytics provides to allow the smart microgrid to more closely match electricity demand and available electricity generation.